To counter all the criticism.
As far as I checked it, this analysis is completely sound and as unbiased as possible.
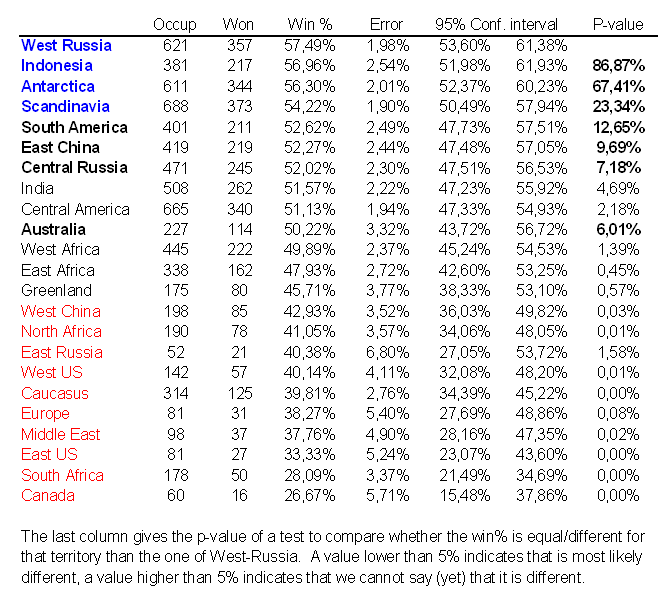
However, I'd like to add a column with the standard errors, confidence intervals and tests though, it gives a lot more information! (inference versus just descriptive statistics)
**Error**: the standard errors of the win%, this depends on the sample size, in this case the number of times occupied, and the success probability itself (win%).
**95% Conf. interval**: lower and upper boundaries of the 95% confidence interval. Interpretation: we are 95% sure that the population wise true (unknown) win% (over an infinite number of games) falls within these borders. For the blue and red territories, 50% is not included, the blue territories score better than 50%, the red worse.
**P-value**: Test to check whether the underlying probability of West-Russia and another territory are different. Interpretation of the %: how likely is it that when West-Russia and the given territory have the same underlying probability, that we get these data? When this value is smaller than 5%, this is very unlikely and we conclude that the given territory has a significantly lower probability. For the bold territories, we CANNOT conclude this. The territory with the underlying best probability is thus one of the 8 territories in bold.
If anyone has any more questions, please ask.
